Exchange 2013 introduced the Managed Availability feature, so Exchange can self monitor and perform recovery actions upon itself. While this has greatly helped Exchange become more self-healing, one of the downsides is that there is no real UI for Managed Availability. The only UI is the Managed Availability Event Logs. All of the configuration inside of Exchange is done using PowerShell. The same applies for reviewing the current health status, you need to use PowerShell.
The main commands to monitor the server are:
Get-ServerComponentState
Get-HealthReport
Get-ServerHealth
Typically we are interested in the latter as that will show us the actual monitor/probe/responder that is not happy. In order to turn it's frown upside down, we need to know which wheel is squeaky.
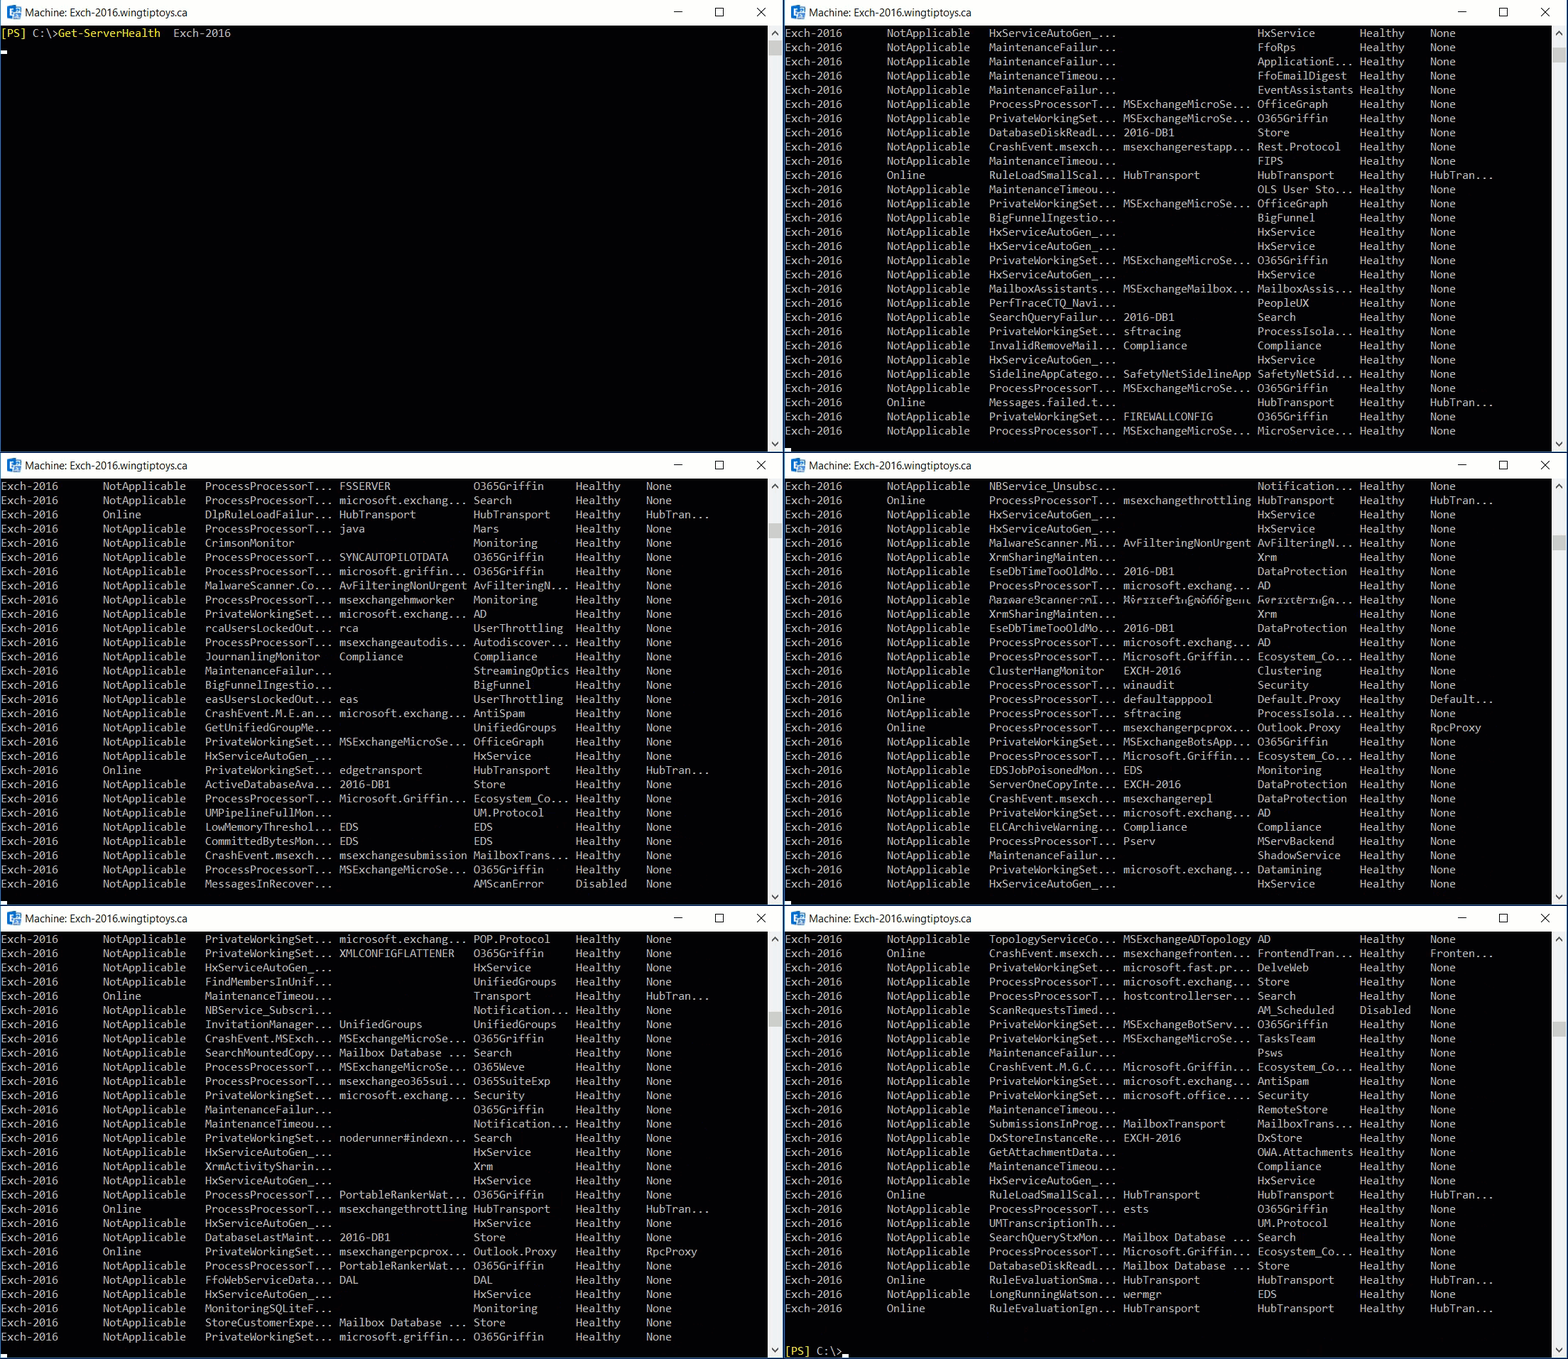
Thus we run the Get-ServerHealth cmdlet, and get the scroll fest shown below:

There is a larger file size version here if you prefer.
Which Components Are Actually Unhealthy?
There is too much output to effectively focus on any issue. To resolve that, we can filter on the AlertValue column, and just report on the elements which are listed as unhealthy.
The below PowerShell filter sample can help with this:
Get-ServerHealth Exch-2016 | Where-Object {$_.Alertvalue -eq "UnHealthy"}
Should you want to use the Exchange Server name where the current Management Shell is connected, give the below a whirl:
Get-ServerHealth (Get-PSSession).ComputerName | Where-Object {$_.Alertvalue -eq "UnHealthy"}
Cheers,
Rhoderick
