This case illustrates the "fun" with Managed Availability a particular customer had after making changes to their servers. The servers were built back in 2014, and as such the default self signed certificates had expired and were previously replaced. This is because the Exchange self signed certificates have a 5 year validity period.
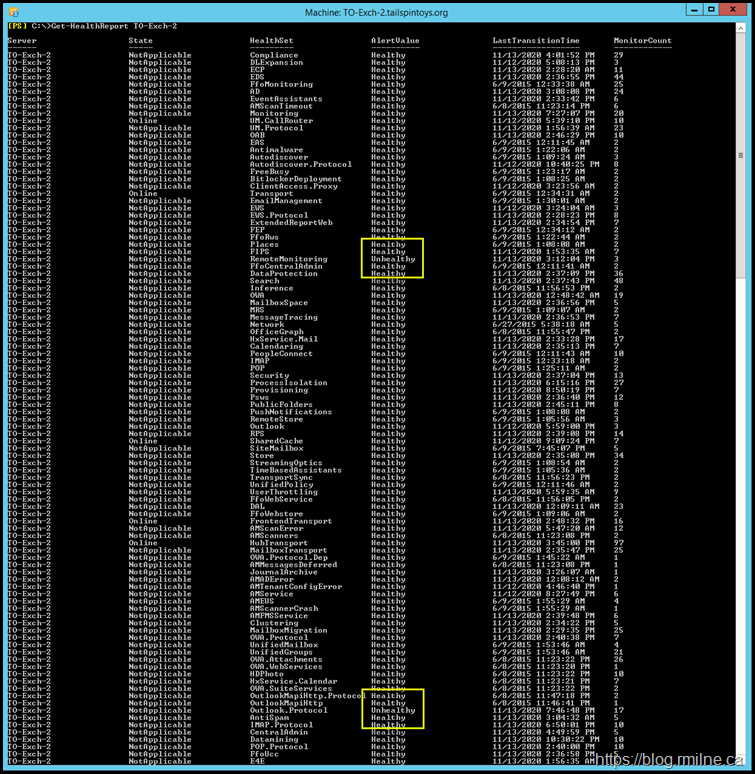
It was noted that Managed Availability was not healthy in all regards. This can be seen below in the Get-HealthReport.
The relevant sections are highlighted in yellow.
And for the more detailed view, in the output from Get-ServerHealth. Note that filter is applied as per this QuickTip to help focus in on the issue.
The output is slightly truncated. We can select the more important columns.
Get-ServerHealth TO-Exch-2 | Where-Object {$_.Alertvalue -eq "UnHealthy"} | Select-Object Name, Identity, HealthSetName
Much better!
We can see that there are two Outlook elements which are listed as unhealthy.
Outlook.Protocol\OutlookRpcSelfTestMonitor
Outlook.Protocol\OutlookRpcDeepTestMonitor
Both of these belong to this HealthSet Outlook.Protocol - this is the health set we will focus on for this post.
The HealthManagerObserverMonitor is unhealthy as a separate server is powered off with unrelated issues in the lab. We will ignore that one.
Just How Bad Is It Doctor?
Let's look at all of the Outlook.Protocol HealthSet entries and review their status. Is it just those two which have an issue? We will use the -HealthSet parameter to specify we only want to see the Outlook.Protocol monitors.
Get-ServerHealth -Server TO-Exch-2 -HealthSet Outlook.Protocol | Select Name, TargetResource, AlertValue
Managed Avaialbility has lots of pre-defined elements, and you can this in the output above. The two that are unhealthy contain the phrase TestMonitor so we can use that to filter on them.
For reference, the full details of these two monitors are shown below.
Get-MonitoringItemIdentity -Server TO-Exch-2 -Identity Outlook.Protocol | Where {$_.Name -Match "TestMonitor"}
Dive Into The Monitor and Probe Details
So we have seen that two monitors are unhealthy and how to isolate the their details. The question is – why? Once we understand that we can fix the issue.
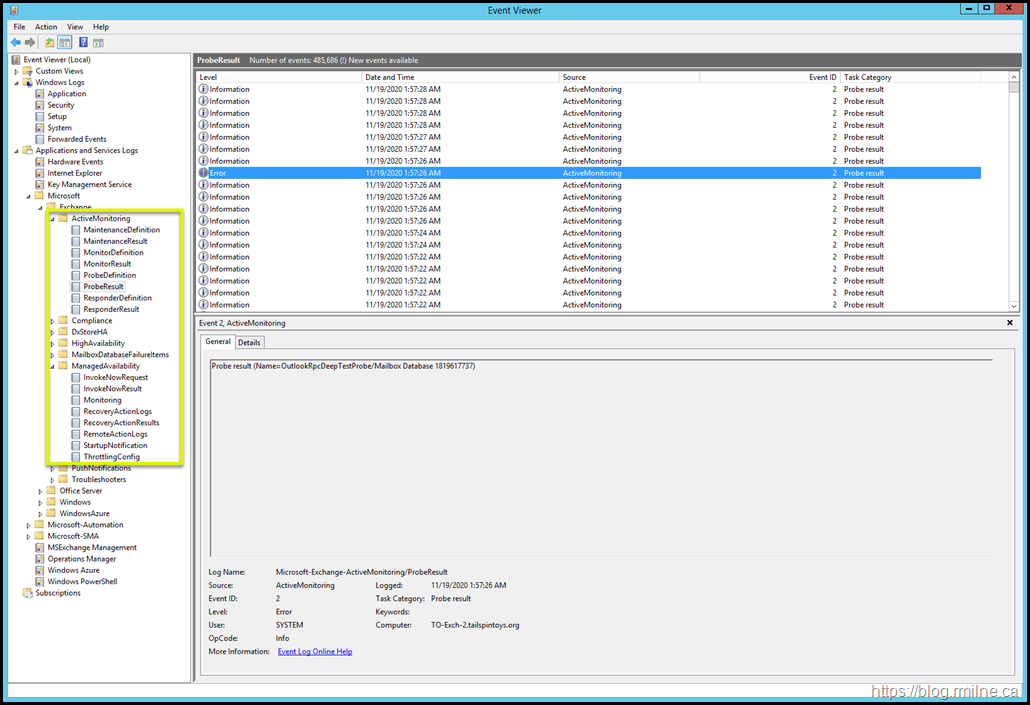
Managed Availability writes (lots) of information into the event logs, specifically the crimson channel. In the below image, note that we have navigated down to the Active Monitoring section as indicated in the left hand tree.
These event logs are VERY chatty. Manually searching for details is almost impossible in most cases. This is a lab server with no activity, yet there are almost half a million log entries in the log shown above.
PowerShell can help search and filter, we just need to know which log we need to look at and which monitor or probe has the issue.
To start with, let's look in the ProbeDefinition log to see which probes are associate with the Outlook RPC Test monitors. This is event log:
Microsoft-Exchange-ActiveMonitoring/ProbeDefinition
And we will search for traces of these:
Outlook.Protocol\OutlookRpcSelfTestMonitor
Outlook.Protocol\OutlookRpcDeepTestMonitor
We can use the Get-WinEvent cmdlet and filter on data contained within the event log entry. Note that we need to look at the details of the event log entry and since they are XML formatted that is why the query is using that data type.
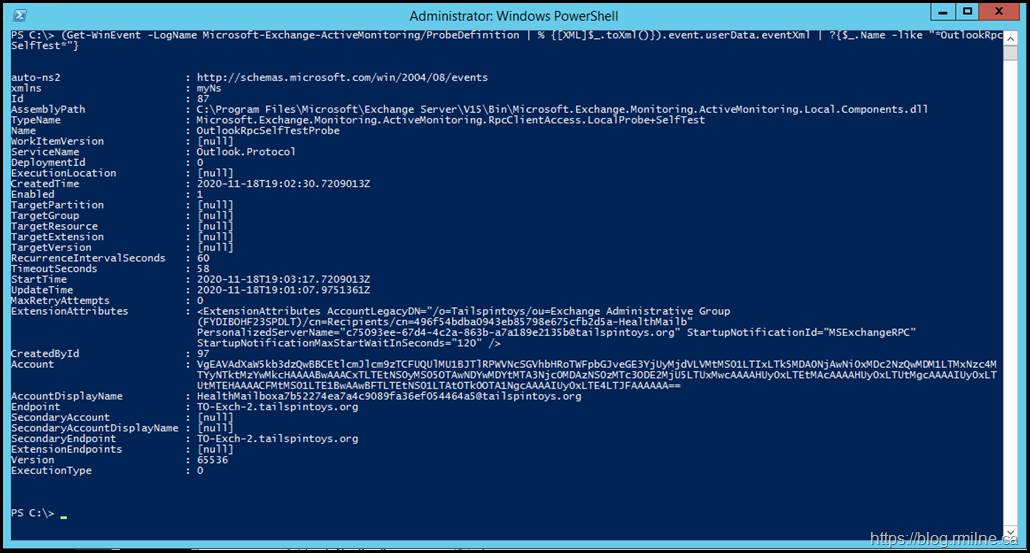
(Get-WinEvent -LogName Microsoft-Exchange-ActiveMonitoring/ProbeDefinition | % {[XML]$_.toXml()}).event.userData.eventXml | ?{$_.Name -like "*OutlookRpcSelfTest*"}
Good – we can see that there is a probe definition present for OutlookRpcSelfTest.
Now let's do the same for the OutlookRpcDeepTest.
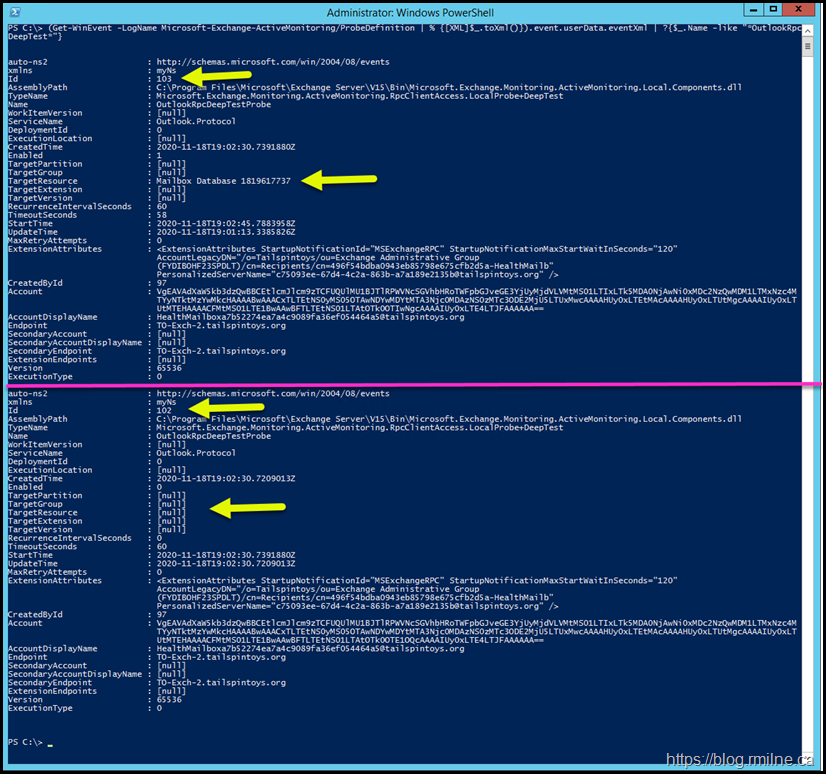
(Get-WinEvent -LogName Microsoft-Exchange-ActiveMonitoring/ProbeDefinition | % {[XML]$_.toXml()}).event.userData.eventXml | ?{$_.Name -like "*OutlookRpcDeepTest*"}
Note that this command actually returns two probes. This fact is more easily seen in this filtered view:
This is not so easy to ascertain looking at the full output, but compare the highlighted elements and you will see there are two separate instances.
The horizontal purple line provides a visual break between the two probe definitions.
These two probes have different targets so they are not a duplicate.
Now that we have verified the probes are actually present, what results do they return?
Review Probe Results
This time we need to look at the log which contains the results, this is:
Microsoft-Exchange-ActiveMonitoring/ProbeResult
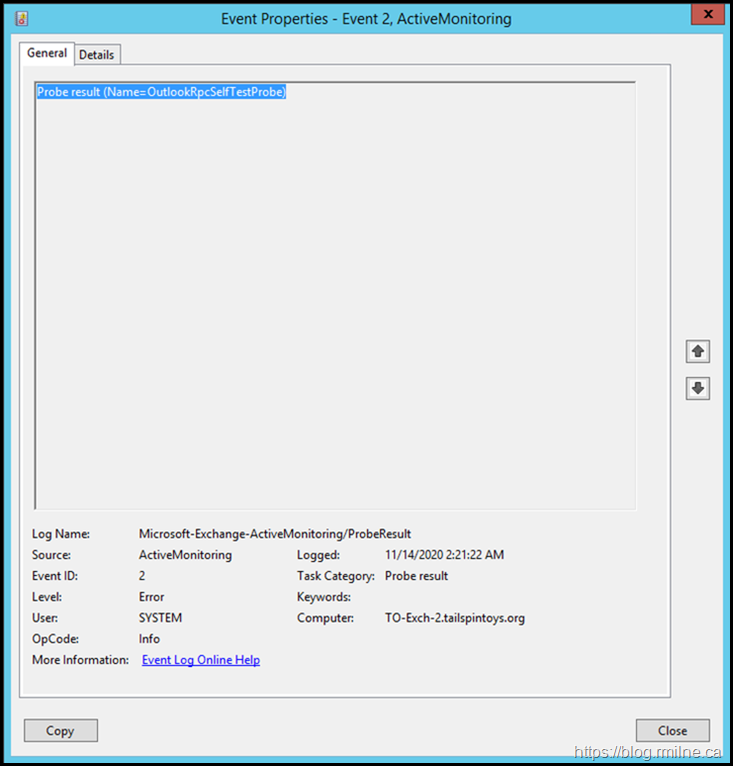
Looking for matching entries of the OutlookRpcSelfTestProbe the below error jumps out. Seems like a match.
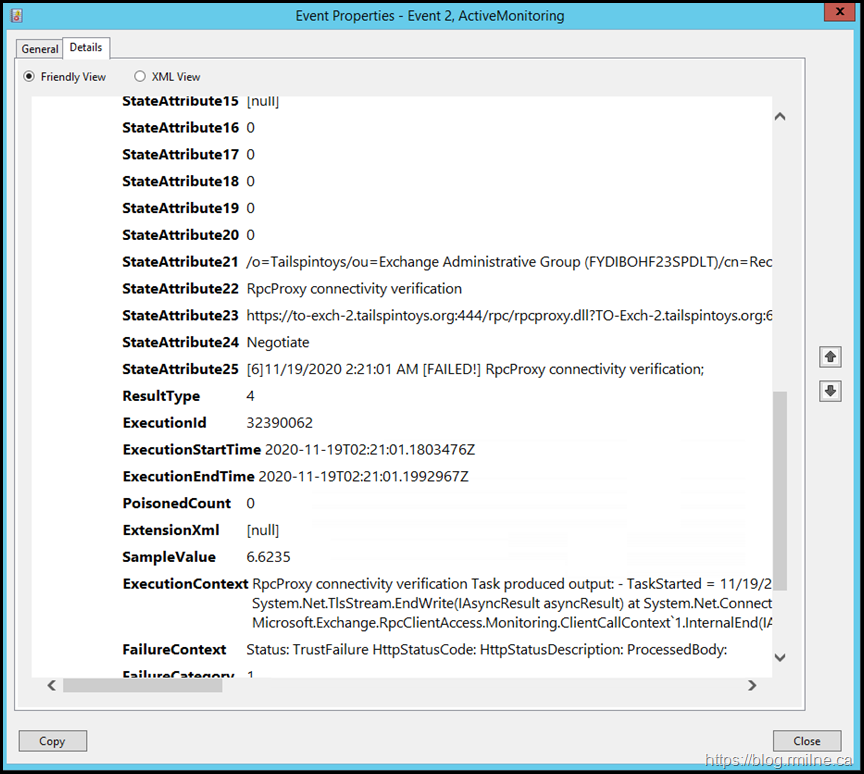
All of the necessary details are in the details of the event log entry. Let's go look and see what we can see.
Right away we can see TrustFailure HttpStatusCode – that sounds like a certificate or TLS issue. Since it is hard to show all of the content in the ExecutionContext element, it is pasted below. Sections of interest are highlighted.
ExecutionContext RpcProxy connectivity verification Task produced output: - TaskStarted = 11/19/2020 2:21:01 AM - TaskFinished = 11/19/2020 2:21:01 AM -
Exception = System.Net.WebException: The underlying connection was closed: Could not establish trust relationship for the SSL/TLS secure channel.
---> System.Security.Authentication.AuthenticationException: The remote certificate is invalid according to the validation procedure. at System.Net.TlsStream.EndWrite(IAsyncResult asyncResult) at System.Net.ConnectStream.WriteHeadersCallback(IAsyncResult ar) --- End of inner exception stack trace --- at System.Net.HttpWebRequest.EndGetResponse(IAsyncResult asyncResult) at Microsoft.Exchange.RpcClientAccess.Monitoring.VerifyRpcProxyClient.VerifyRpcProxyContext.OnEnd(IAsyncResult asyncResult) at Microsoft.Exchange.RpcClientAccess.Monitoring.ClientCallContext`1.InternalEnd(IAsyncResult asyncResult) - ErrorDetails = Status: TrustFailure HttpStatusCode: HttpStatusDescription: ProcessedBody: - Latency = 00:00:00.0066235 - RequestUrl = https://to-exch-2.tailspintoys.org:444/rpc/rpcproxy.dll?TO-Exch-2.tailspintoys.org:6001 - CertificateValidationErrors = RemoteCertificateChainErrors RpcProxy connectivity verification failed.
FailureContext Status: TrustFailure HttpStatusCode: HttpStatusDescription: ProcessedBody:
That really does sound like an issue with the certificate, note that this is for the Exchange Back End web site. We know this as the URL highlighted (https://to-exch-2.tailspintoys.org:444/rpc/rpcproxy.dll?TO-Exch-2.tailspintoys.org:6001) references TCP port 444 which is used on the Exchange Back End web site binding.
Exchange Back End Web Site Binding
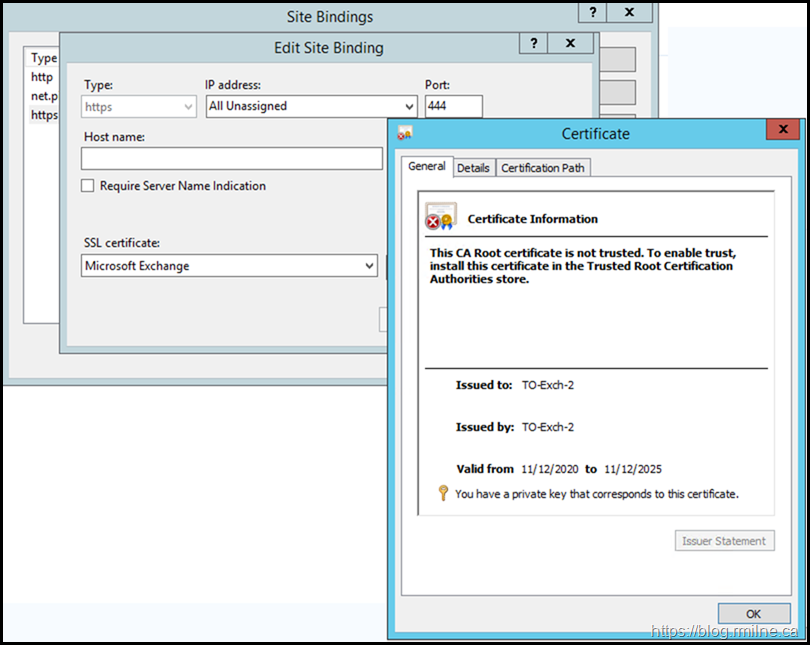
Let's look at the binding for the Exchange Back End web site. Is there a certificate, and is it trusted?
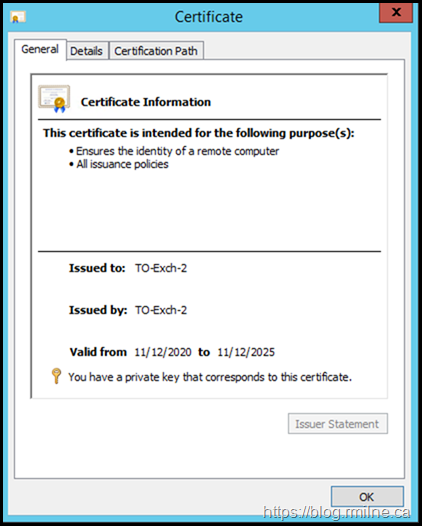
The configuration is shown below.
Well we have a certificate, the date is valid but it is NOT trusted.
Turn Back Time
After enquires were made about the previous changes on the server, it was noted the customer had replaced the Exchange self signed certificates using this procedure.
However, Exchange does NOT mark certificates created by the New-ExchangeCertificate cmdlet as trusted. This is discussed and outlined in this post.
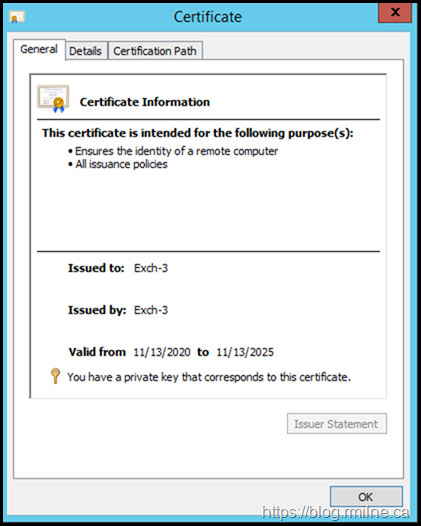
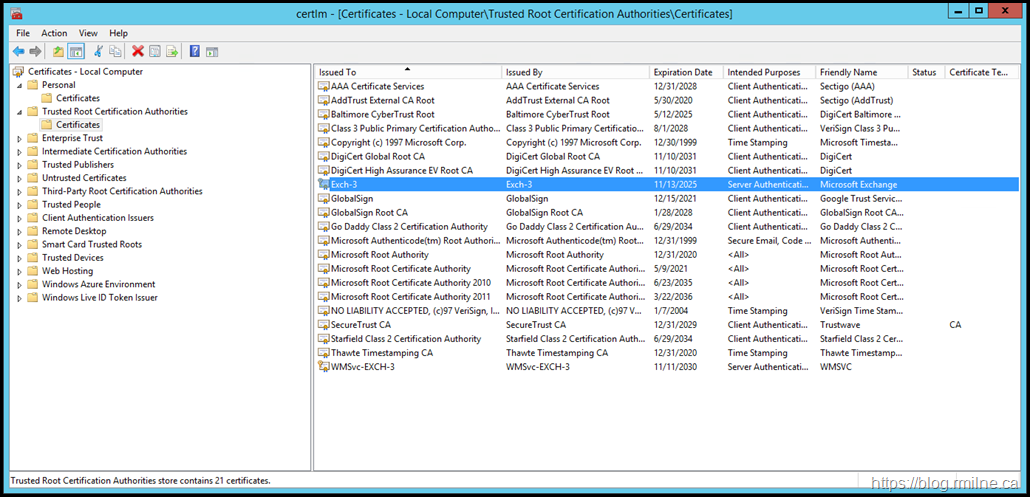
As a reference, the below is from a separate Exchange 2013 server (server name is Exch-3) that was a fresh 2013 CU23 install. Note that the self signed certificate created during the install is trusted. As noted in the other blog post, the same happens with Exchange 2016.
On the other server (Exch-3), the self signed certificated created during installation of Exchange was automatically added to the Trusted Root Certification Authorities store. This is shown below, it is the certificate highlighted.
Resolution
Now that we have identified the failing probe, the error reported and the reason why it is now time to get this fixed up.
The newly created Exchange self signed certificates was added to the Trusted Root CA store on the local server. This will need to be repeated on each server.
We can wait for Managed Availability to run and update the status.
Alternatively we can manually run the probe to view the results.
Invoke-MonitoringProbe -Server TO-Exch-2 -Identity Outlook.Protocol\OutlookRpcSelfTestProbe
Cheers,
Rhoderick





Thanks for the detailed procedure. Solved my problem.
It always impresses me when I find articles like this on personal blogs. Very informative, detailed, and includes just enough information for beginners like me to follow along. The best part is - there are no ads, so you clearly enjoy not only what you do, but giving back to the IT community as well!
Bravo, and keep up the great work!