Note: The follow-up can be found here: https://blog.rmilne.ca/archive/2012/07/19/using-pal-template-to-easily-capture-performance-data.aspx
 Clint Huffman Tweeted that he released an updated build of the PAL (Performance Analysis of Logs) tool.
This build contains both fixes and other welcome additional improvements to an ever growing list of templates which is always great to see!
For those who have not yet used PAL, it is a very neat tool that solves issues when it comes to analyzing performance issue. The two major issues are typically
-
What counters do I need to look at?
-
OK, so that counter has a value of 10. Is that good or bad?
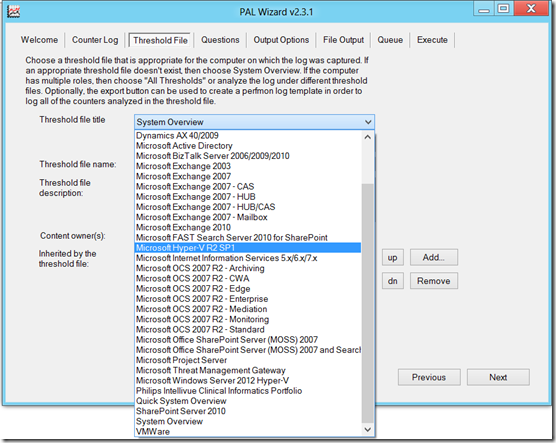
PAL asks you to chose from a predefined list of templates, and once you choose the appropriate one, lets say Exchange 2010, that template has the capability to help capture the correct information and then analyse it. This way you capture the correct data, and then PAL will produce a HTML report indicating the areas that are of concern.
Personally I prefer to install the PAL tool my workstation so I am not installing additional items onto production servers and waiting on change approval.
There are a couple of prerequisites for the tool:
- PowerShell v2.0 or greater
- Microsoft .NET Framework 3.5 Service Pack 1
- Microsoft Chart Controls for Microsoft .NET Framework 3.5
Microsoft Chart Controls for Microsoft .NET Framework 3.5 must be installed on the machine where PAL will be installed, you can download this in advance or if the machine has Internet access PAL will direct you to the download page.
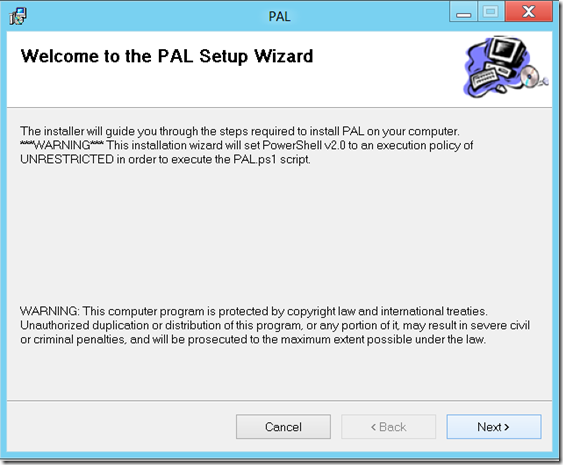
Download the appropriate PAL installer files and start the install.
Note: The PowerShell execution policy will be set to unrestricted to allow scripts to run. This is called out in the installation wizard, but is good to be aware of in case this is locked down via GPO in your environment.
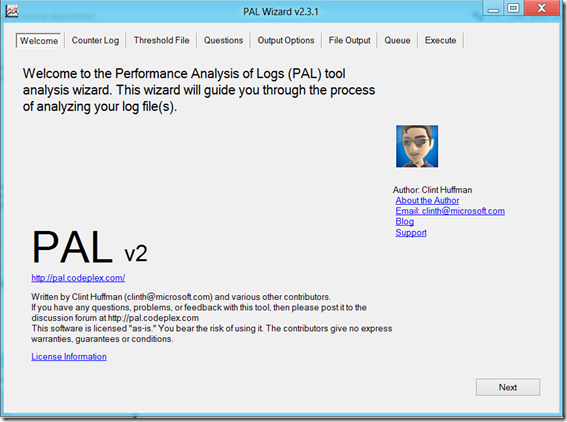
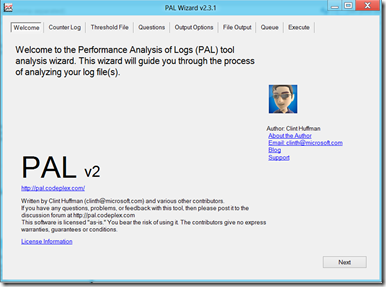
Open the tool from the link created in the program files, and it will show the welcome tab as displayed below. Navigate through the tool using the tabs along the top, or the Next button at the bottom.
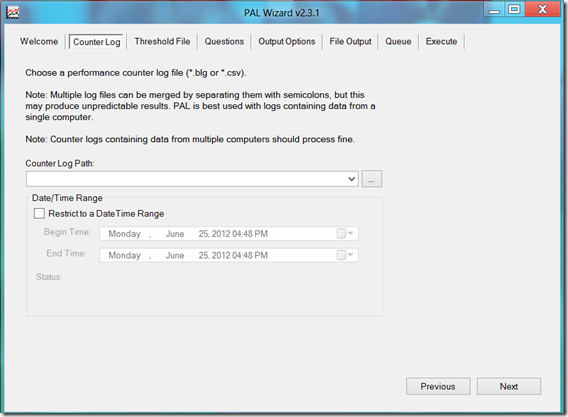
If you have an existing performance monitor file (.blg or .csv) then the file can be opened from here. Appropriate date and time restrictions can also be entered.
The threshold tab contains the real intelligence of the tool and it is from here that the performance template can be selected.
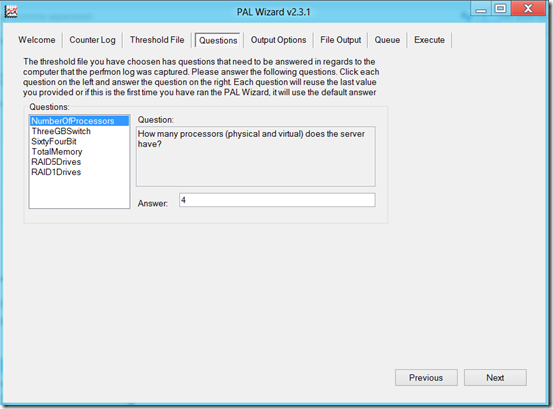
The questions tab asks for information about the server where the data was collected. It does not ask for:
- Your favourite colour
- The capital of Assyria
- The air-speed velocity of an unladen swallow
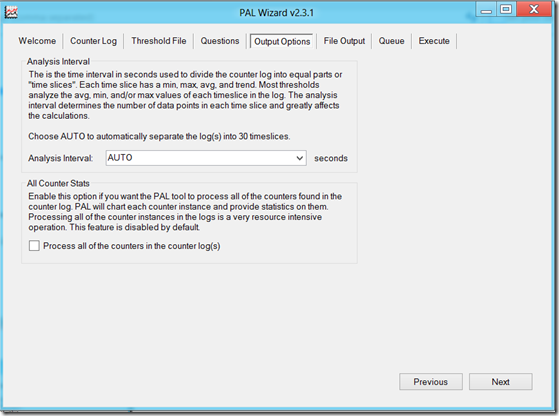
Output options allows you to override the default 30 second time slice or to process all counters in the log file.
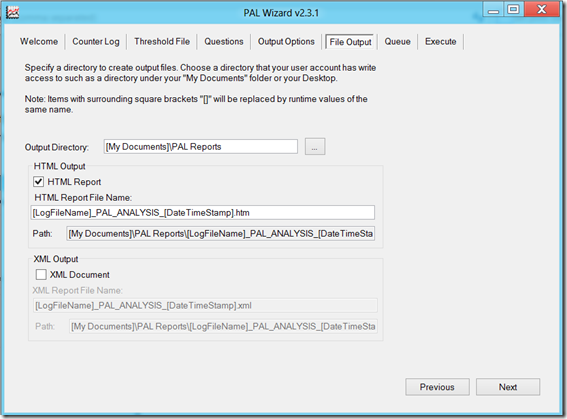
File output enables changing the default output directory and also enable XML output in addition to the regular HTML output. Take note of the directory as this is where you will go to see saved reports.
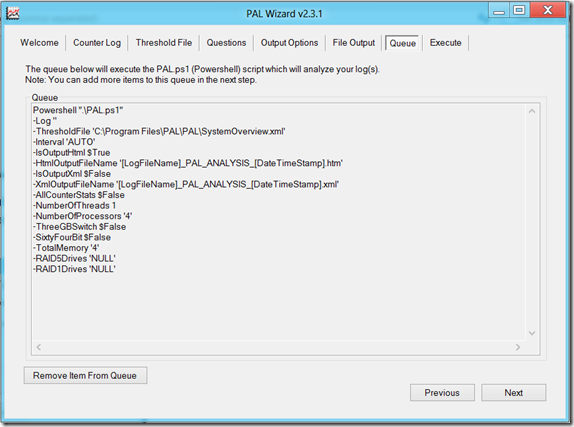
Queue shows what is pending execution. You can run a single item or multiple items in a given queue.
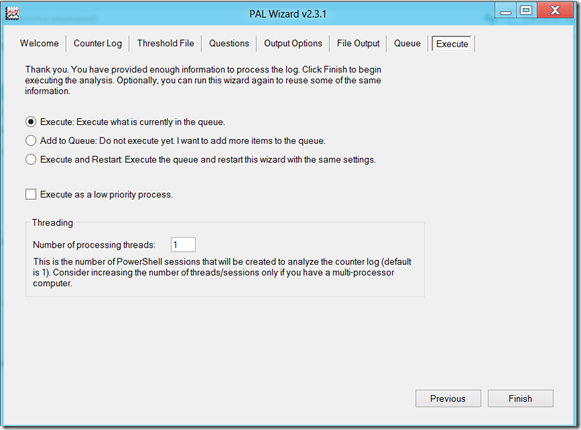
Finally the Execute tab will kick the tyres and let things rip, though it is possible to not start the run and simply add the work item to the queue so other items can be added. Note the threading options to increase the number of PowerShell sessions to make use of machines with available CPU capacity.
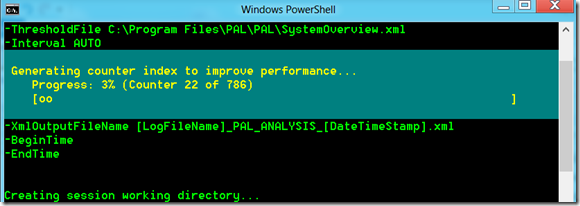
Once the queue is executed, the appropriate number of PowerShell windows will appear and data crunching will begin!
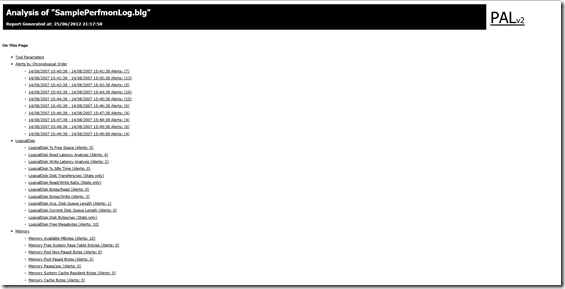
The report will be saved to the directory specified on the Output options tab. Note that by default there will be a .HTML and a folder which contains all the graph elements. PAL will open the report up in your browser. You can view the results in chronological order to get an overview of what happened and when. Alternatively you can click to drill down to a sub section such as logical disk and see the associated information there.
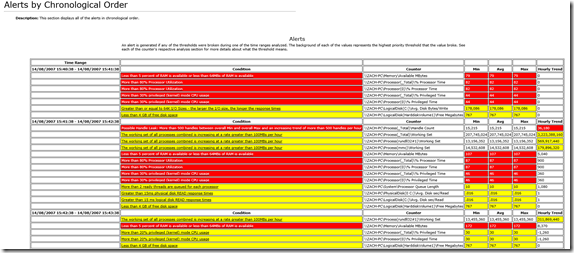
The sample perf log file shows the below chronological events
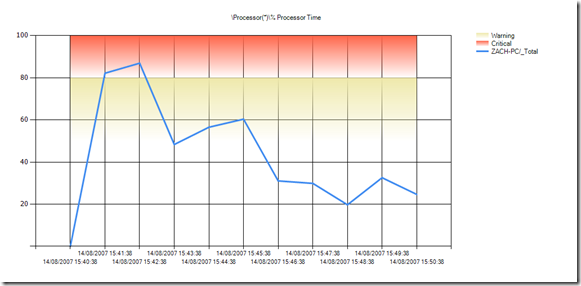
By clicking the entry in the condition column, you will be taken directly to that section in the report. For example clicking on the high CPU utilization will take you to the below graph:
So you can now see how PAL is a great help with analyzing captured performance log files!
I’ll cover how it can also help with capturing logs in an upcoming blog post.
Note: The follow-up can be found here: https://blog.rmilne.ca/archive/2012/07/19/using-pal-template-to-easily-capture-performance-data.aspx
Cheers,
Rhoderick
