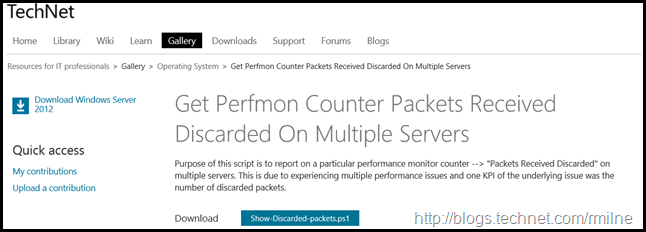
Whilst working on a customer’s Exchange 2010 DAG issue, I wrote a quick script to quickly grab some performance monitor counters from all of their Exchange servers. The issue that we were investigating was related to discarded packets when the VM was running on a certain hypervisor host. The customer had moved their Exchange VMs to a new host and after doing so they were experiencing cluster issues. Randomly nodes would be dropped from cluster membership which would impact the Exchange 2010 DAG as any active copies of those Exchange databases would then have to be mounted on another server. The activation was happening automatically (as expected) but it is still not a desired state.
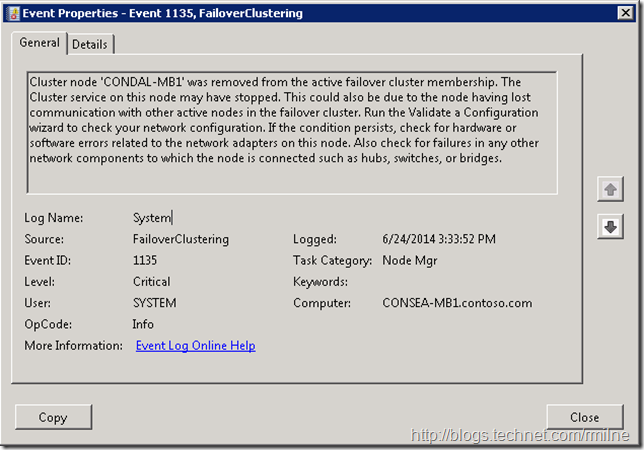
On the Exchange servers we observed EventID 1135 – Cluster node was removed from the active failover cluster membership.
At this point we did not do the typical knee jerk reaction that normally happens -- which is to simply rack up the cluster timeout values. Why you ask? Well that does not address the root cause, and only masks the symptom.
Update 18-11-2014: Please see this post for a script to retrieve the number of 1135 EventId errors on multiple servers.
Update 19-4-2015: Adding link to KB 2634907 "TCP/IP packets that are received out of sequence are discarded in Windows 7 or in Windows Server 2008 R2' for reference. This is an issue with Windows Server 2008 R2 and may cause discarded packets. At the time of adding comment, servers should already be patched beyond these builds.
Oh Issue, Where Art Thou?
We quickly checked the basics, and made sure that the Exchange 2010 recommended DAG update (it’s a cluster update but Exchange recommends it strongly) was installed, and also the generic updates recommended for the version of the OS Exchange was installed onto. They are discussed in this post along with other Exchange 2010 deployment tweaks.
None of this made a difference. The cluster still experienced EventID 1135 cluster disconnects. Since this only started after the VMs were moved to the new host, known issues for those hosts were then reviewed. In VMware KB 1010071 and 2039495 these symptoms are discussed and Exchange 2010 is specifically tagged in the second article.
While the hypervisor admins have their own tools to report and investigate such issues, we can use Performance Monitor to see how Windows perceives the lay of the land.
The counter that we were looking at was “Packets Received Discarded”. The sample image below is from Hyper-V and shows the location:
From the Perfmon description: Packets Received Discarded is the number of inbound packets that were chosen to be discarded even though no errors had been detected to prevent their delivery to a higher-layer protocol. One possible reason for discarding packets could be to free up buffer space.
This is great – we can use this counter to look at the issue, but how to do it easily across multiple servers? And then potentially across every single VM that the customer has since if we are hitting the issue on one set of VMs what other VMs are affected? We could:
-
Open Perfmon locally on each box and then (hell no, let’s stop the crazy talk right there)
-
Open Perfmon and add the counter in for each server – ugg…
-
Create an input file specifying serverperfcounter and feed this to logman.exe
-
Some PowerShell scripting to remotely retrieve the perf data – sold!
PowerShell To The Rescue
To see if we were experiencing the issue across multiple Exchange servers, and to gauge the severity I wrote a quick PowerShell script that would pull in the required performance counters from multiple servers quickly and easily. This uses the Get-Counter cmdlet as shown here:
Get-Counter "\Network Interface(*)\Packets Received Discarded" -ComputerName $Server
The script will get a collection of NICs from the specified server, and then loop through them and remove the pseudo ones. For example do not want to see Teredo, ISATAP or 6to4 interfaces. For the purposes of this script we are concerned with the physical ones, and that includes the "physical" NICs that are made visible in virtual guest Operating Systems. NIC names are not hardcoded into the script else it would not be portable across physical server types and hypervisors.
You can obtain this from GitHub.
Update 22-10-2014: Updated script to also include OS uptime and OS installation date
Using the script, we were able to quickly check all of the customer’s servers and quickly pinpoint trends in the environment. One half of the DAG servers were experiencing discarded packets many times higher that the others, and the trends were noted on both MAPI and REPL networks. This allowed us to focus on particular hypervisor hosts.
Armed with this data, we then could ask why specific VMs were more impacted than others and prove it. It turns out that the Exchange VMs had 64GB of RAM assigned and had been placed onto hosts which had 64GB of physical memory. Since there was no free memory for the hypervisor, this was placing pressure onto the hypervisor and exacerbating the issue.
Bootnote
This is an issue that has received attention in the past from the Exchange community. In addition to the other great posts out there on this topic, I posted this to set the context around the script as we all want an easy to check lots of servers and potentially monitor for this issue.
Cheers,
Rhoderick


