Well, OK. Time did not really forget about these poor, un-loved tools – it was us administrators!
There are numerous little tools and utilities that are no longer commonly used by a lot of admins. This may be due to the fact that they are using a different tool, or it may just have faded from memory a little. Or you may be runing in Azure rather than on dated hardware. Or that your storage is all SSD and we just do not have the same disk bottlenecks of the olden days, and the same for CPUs. There are now som many cores to shake a stick at!
In the course of my work I often have to look at server performance issues, and spend time sifting through performance logs looking for the underlying root cause. Anything that can speed this process up, is a boon! I thought that it would be good to share some of the little lurkers in my closet. As always, please shout out if your favourite widget/tool is not mentioned!
Performance Monitor – Intro
Performance Monitor, or Perfmon to its close friends, is not really a lost tool but Windows 7 did introduce some features that are not commonly known. Typically I run perfmon.exe to fire up the tool, and do not bother with shortcuts. As you will see later there is another reason for the command line!
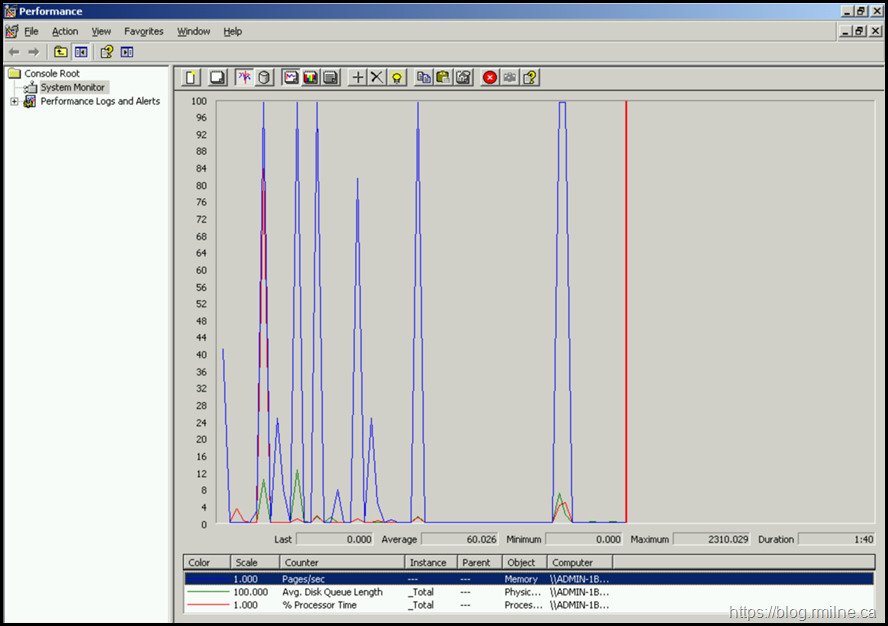
This is Perfmon running on Windows 2003 SP2.
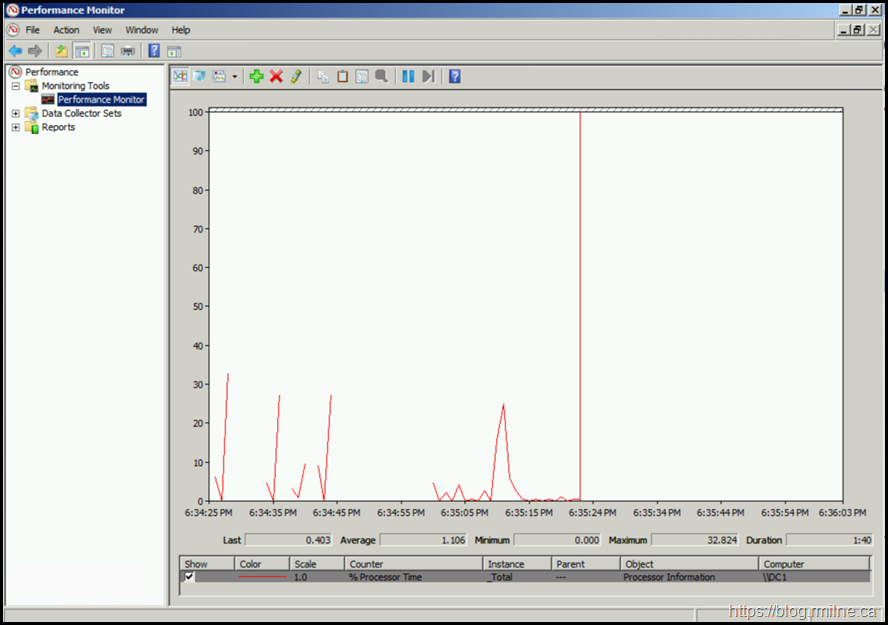
For comparison, this is PerfMon running on Windows 2008 R2 SP1
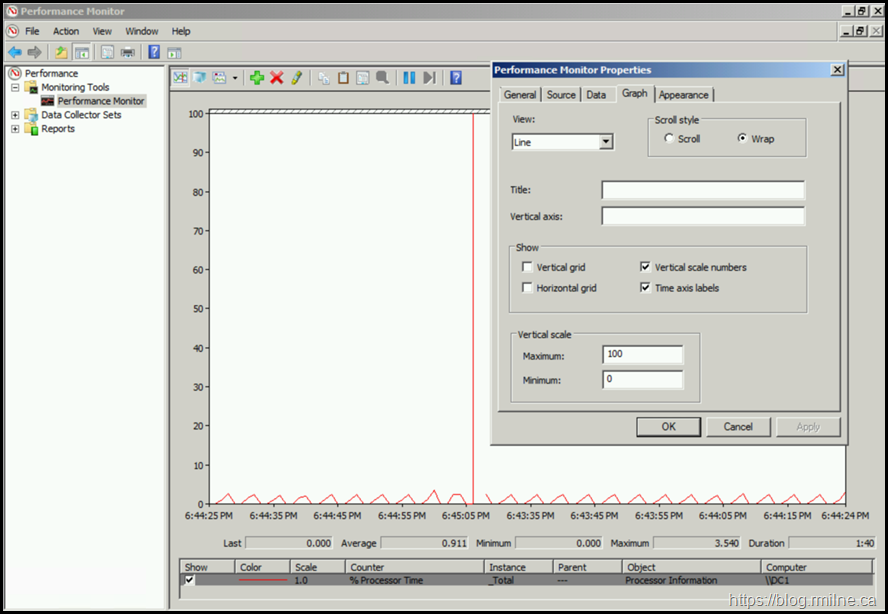
If we righ click on the graph and go into properties, there are more options on the newer version.
Note all of the extra logging capabilities exposed in the 2008 R2 left hand navigation tree.
The above graph is the default counter, and will scroll from left to right. You can change the Graph properties; right click on the white graph (where the CPU activity is shown) select properties and on the Graph tab select Wrap.
Check out the other tabs, and the options while you are there.
Performance Monitor – Copy And Paste Counters
Yes – you can really do this! John Rodriguez wrote a very nice piece for Neil Johnson’s blog and I highly recommend that you check it out. John discusses how to collect a list of counters that can be easily reused to analyse multiple performance log files.
Performance Monitor – Overlay
You can view log files in separate Performance Monitor windows and then compare them with a transparent overlay. Using the overlay feature to compare log files works best when viewing multiple logs based on the same Data Collector Set, since the Performance Monitor graph's proportions change to most efficiently display the range of data in the log file.
-
Click Start , click in the Start Search box, type perfmon /sys /comp , and press ENTER. Performance Monitor will open in stand-alone mode with comparison enabled.
You can only use overlay when Performance Monitor is running in stand-alone mode with comparison enabled.
-
To create a view you will use as a base to compare against, open logs or a data source and add counters from the logs or data source to the Performance Monitor display.
-
When you have finished creating your base view, repeat step 1 to open another instance of Performance Monitor running in stand-alone mode with comparison enabled.
-
To create a view you will use to compare to your base, open logs or a data source and add counters from the logs or data source to the second Performance Monitor display.
-
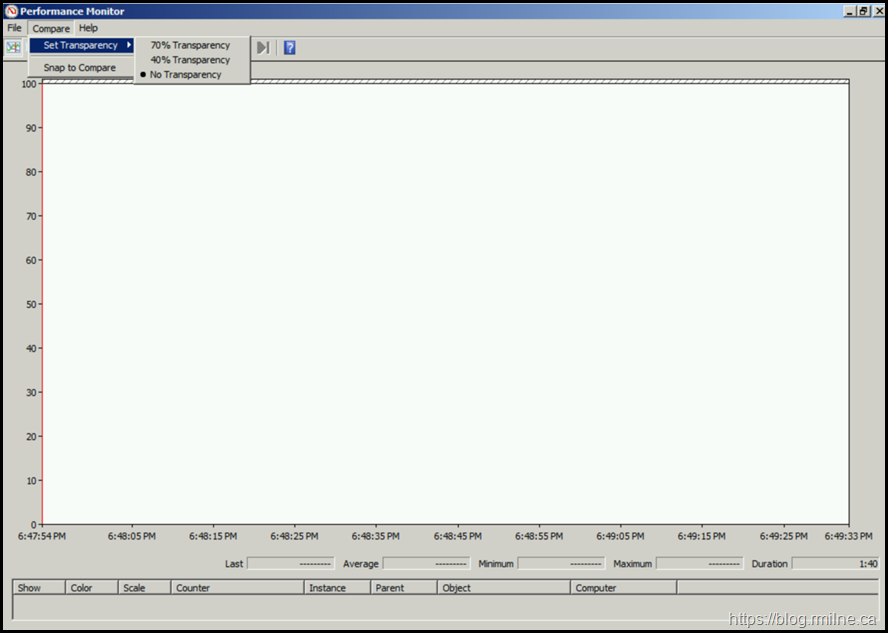
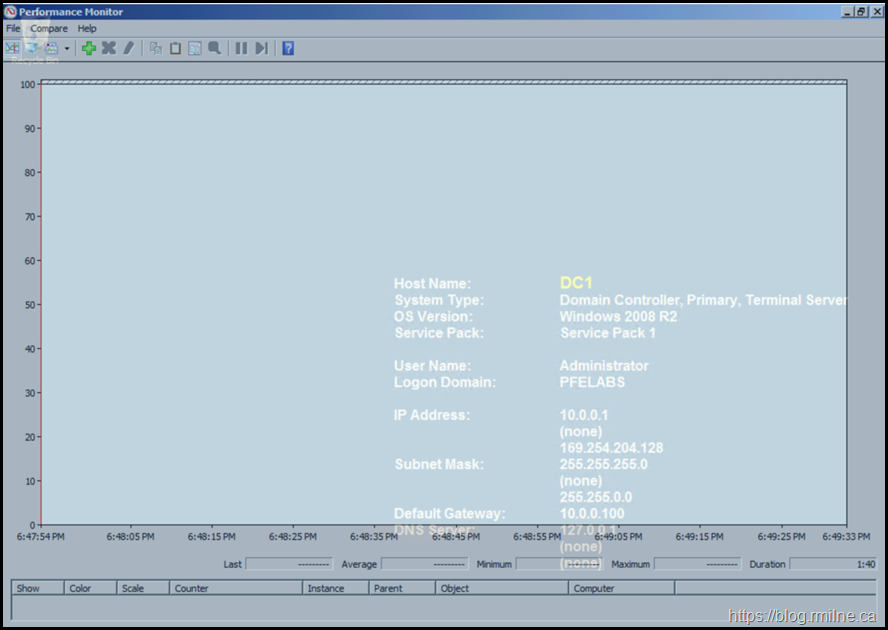
In the Performance Monitor window that you want to compare to your base, on the Compare menu, point to Set Transparency and select either 70% Transparency or 40% Transparency .
-
In the Performance Monitor window you want to compare to your base, on the Compare menu, click Snap to Compare . The active Performance Monitor window will automatically align itself with the other Performance Monitor window.
See also Compare Multiple Log Files in Performance Monitor
Below is Perfmon runng with regular transparacy - i.e. none.
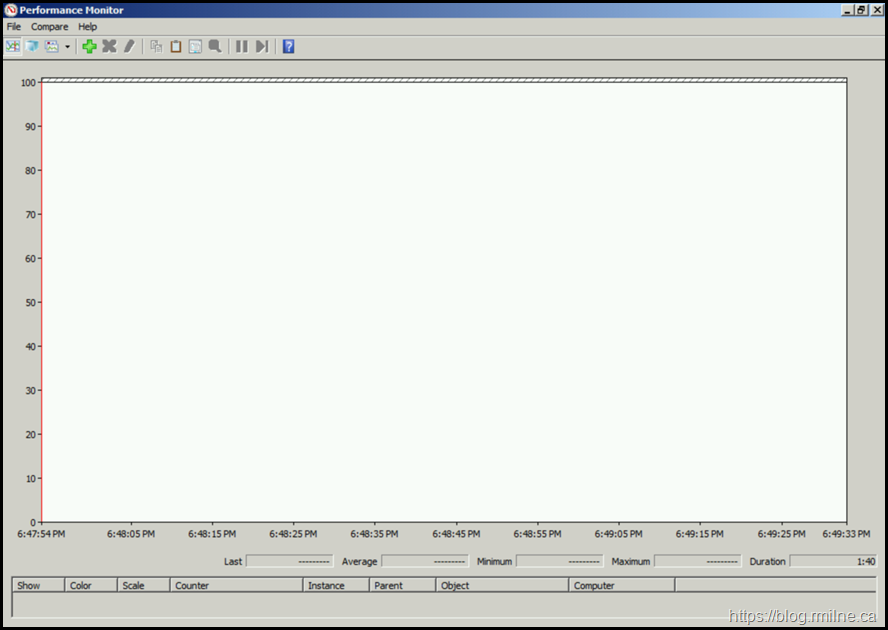
This is visible on the Compare menu.
The below shows an example of the overlay with the front PerfMon instance set to 40% transparency. Note that you can now see the desktop.
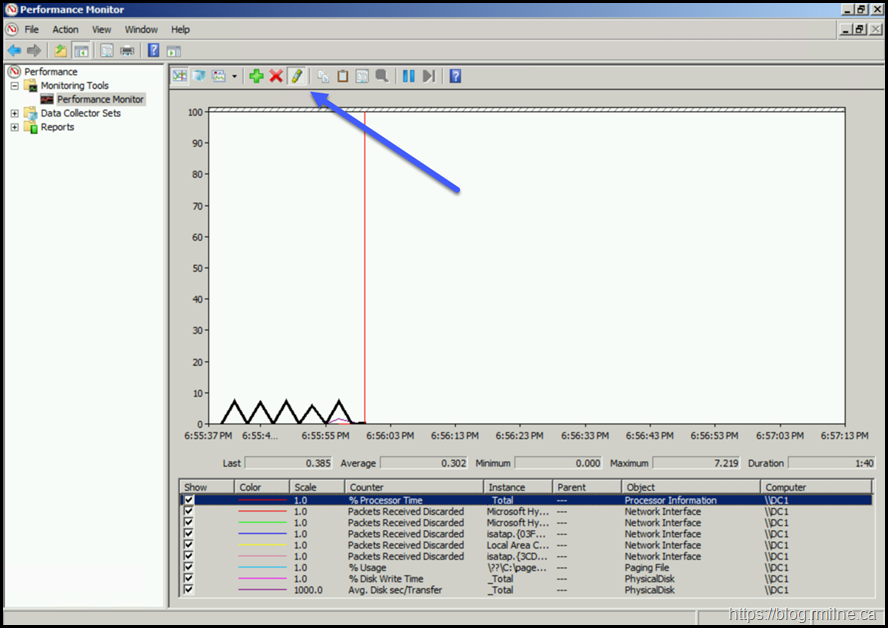
Performance Monitor - Highlight Counter
Control +H will highlight as will the menu option. This is a pencil icon nowadays, in the past it was a lightbulb.
Performance Monitor - Scale Counter
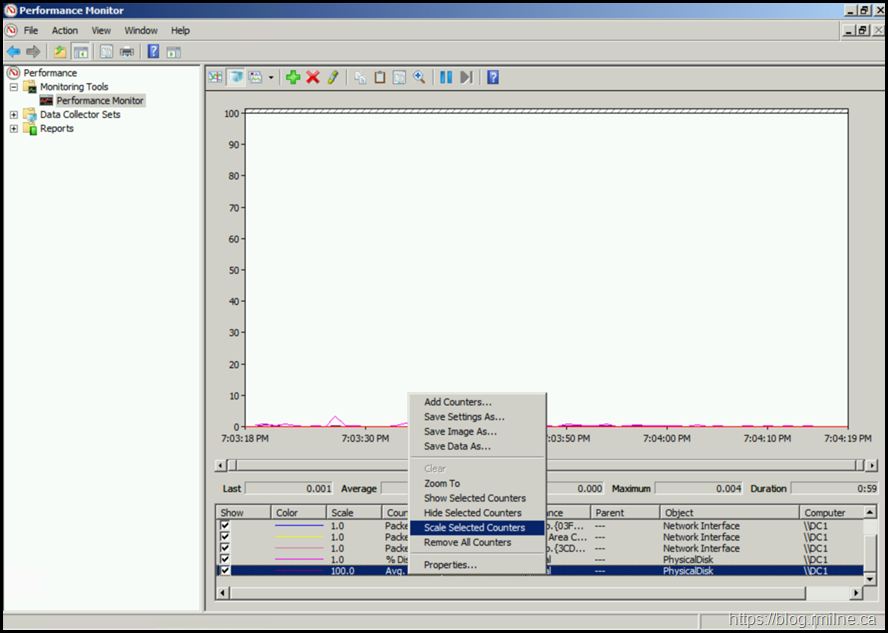
Scale Selected Counters is useful to make a counter more dynamic, i.e. easier to read.
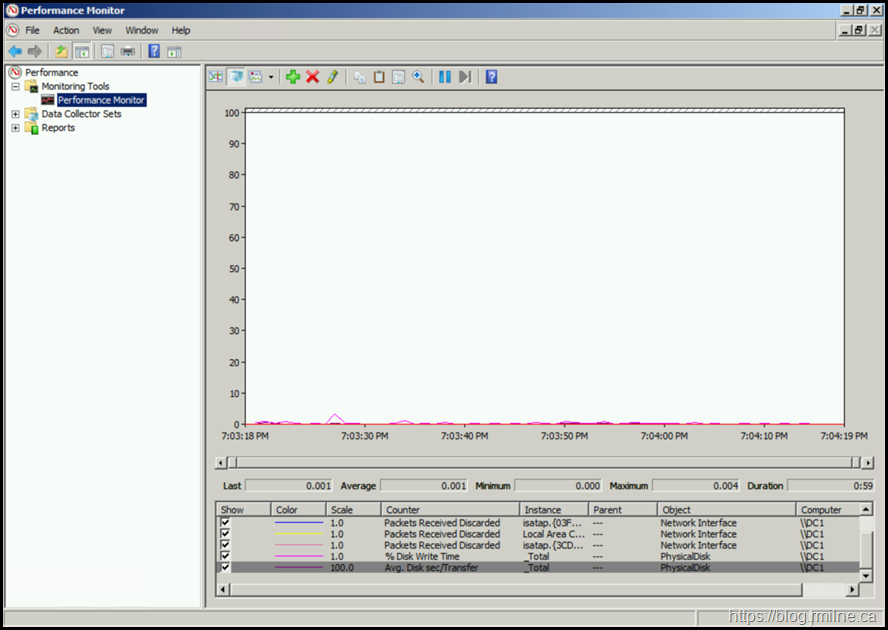
Then we chose to scale the counter:
After scaling note that the range of values is easier to see.
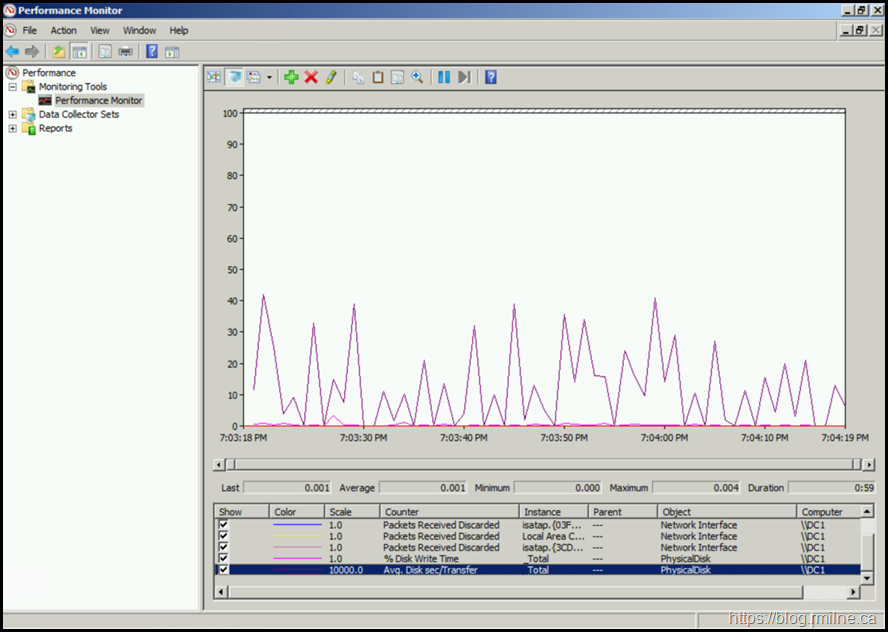
Warning though - the actual numbers remain the same, all tha changes is you make the view more dynamic or spikey. Just like the saying of lies, lies and dammed statistics you need to be careful to avoid making the graph overly sensationalist. Always pay attention to the scale factor used.
The scale settings can also be set in the properties of the Graph as well. It can be convienient to tweak directly from the main view though.
Performance Monitor - Hide Counter
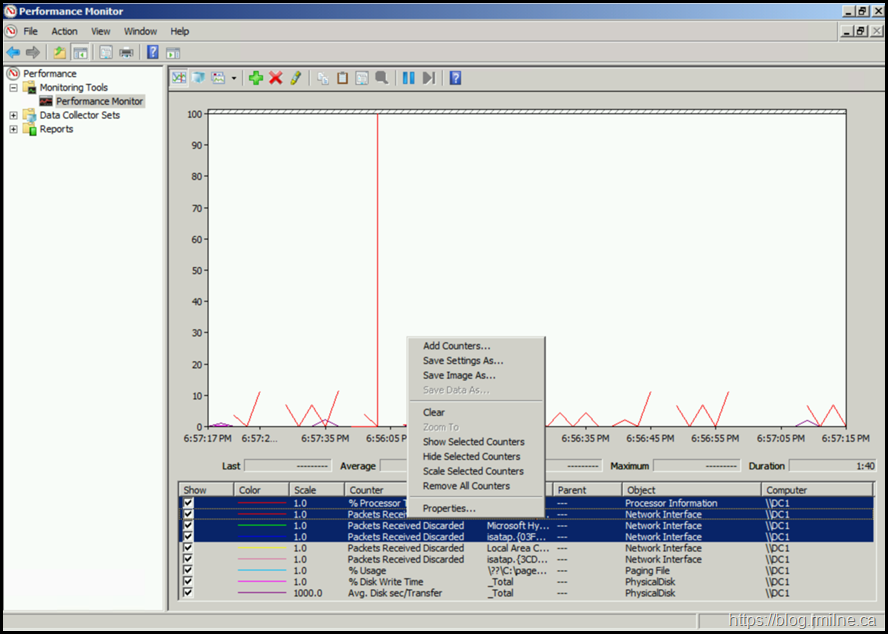
Hide Selected Counters is also useful to remove certain counters that you may want to use again, but not right now. Saves having to totally removed them are re-add.
Performance Monitor – Zoom
Zoom To A Time Window allows you to see a particular time range in the UI, and focus just on that.
We can do that in the graph by selecting the portion of the graph and then selecting Zoom
Or we can do this when we directly open the log itself.
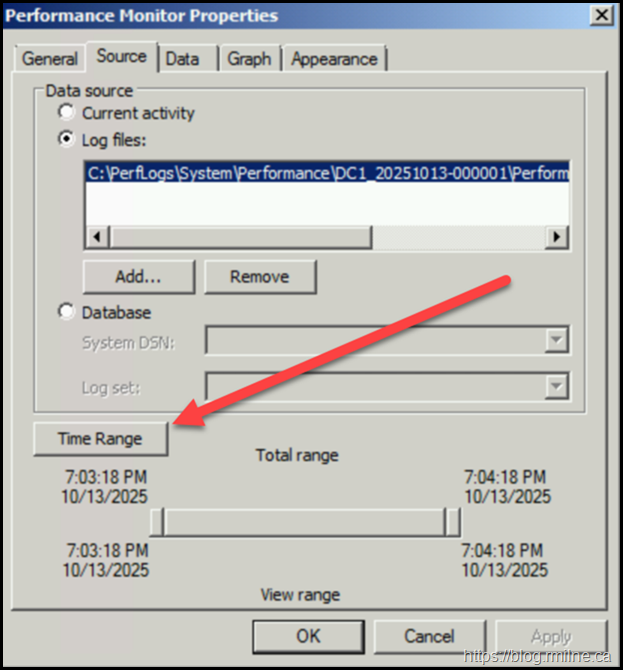
(Note that the image was re-uploaded - hence the date is alter)
Related Utilities
Below are other related tools that go hand in hand with perfmon.
Logman.exe
Tracelogs
Relog.ext
Tracerpt.exe
Tracerpt.exe is part of the Widnows performance toolkit and can convert Event Trace Log (ETL) into readable output. For example:
http://support.microsoft.com/kb/971714
tracerpt *.blg *.etl -df your_tmp_filename.tmp -report your_report.html -f html
Cheers,
Rhoderick